EEG
Backlinking
EEG History
See also -> History of EEG
EEG Studies
See also -> Signal Acquisition
See also -> Electrode Placement Systems
See also -> Reference Systems
See also -> Electrodes
See also -> Conductive solution
See also -> EEG Tasks
EEG physiology
See also -> Bioelectricity
See also -> Brain rhythms
EEG analysis
See also -> EEG data analysis
See also -> EEG microstates
See also -> Global Field Power
See also -> Event-related spectral perturbation
See also -> ERP metrics
See also -> ESI
EEG (update!)
Electroencephalography (EEG) consist of recording of the spontaneous electrical activity generated by active neurons in the brain, mainly the cortex. In general, the brain produces electrical activity divided into two parts – simultaneous rhythmic components, often called brain waves, and event related potentials, related to sensory stimulation or task-related thinking (Furth & Ph, 2018).
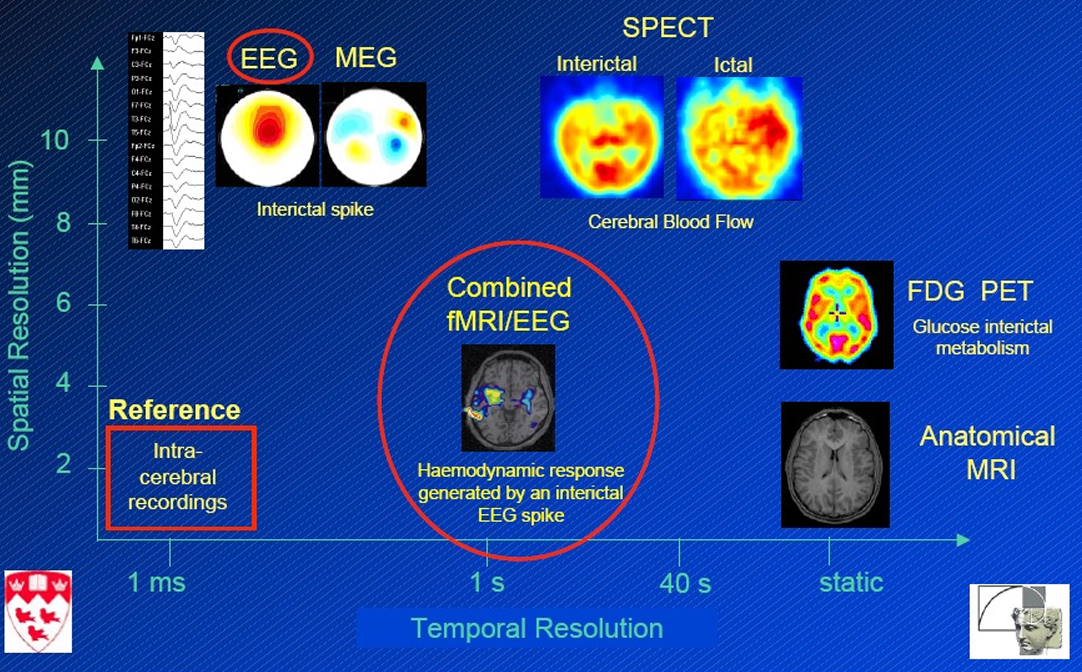
Figure 87. EEG temporal and spatial resolution.
EEG mainly records the activity of pyramidal cells of the cortex (layers VI, V, IV, III/II) (Thomson et al., 2007). The EEG does not record APs, but it records fPSPs, either excitatory or inhibitory. A single PSP is not strong enough to be registered by the EEG but fPSPs generate a dipole which is strong enough to be registered by the EEG. The temporal summation of several PSPs, which reflects the synchronous activity of the cortex, contributes to the intensity of the signal to be picked up by the EEG; in fact, it is necessary that there be at least
The temporal resolution of EEG is determined by the sampling rate of the acquisition. It is generally between hundreds and a few thousands of samples per second. The temporal precision, in contrast, depends on the analysis applied. temporal accuracy is extremely high because brain electrical activity travels instantaneously (within measurement possibilities) from the neurons generating the electrical field to the electrodes that are measuring those fields.
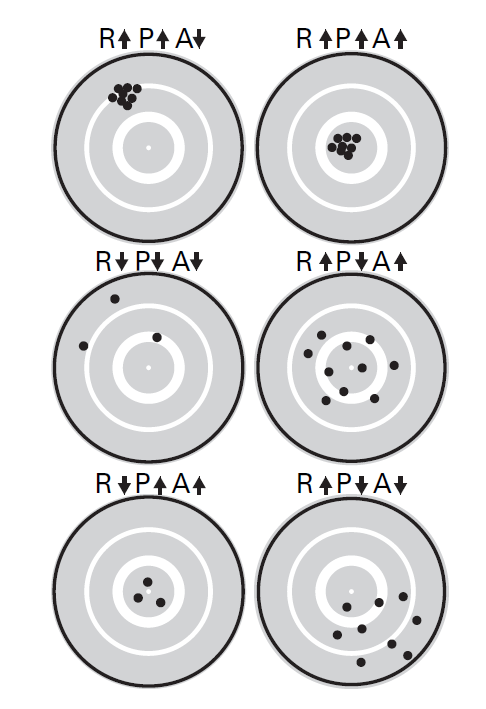
Figure 88. Bull’s-eye illustration of the differences among resolution (R), precision (P), and accuracy (A). Up-and down arrows indicate high and low levels. Resolution is illustrated by the number of dots, precision is illustrated by the spread of the dots, and accuracy is illustrated by the distance of the dots away from the center of the bull’s-eye.
Although EEG has high temporal precision, resolution, and accuracy, its spatial precision, resolution, and accuracy are all relatively low compared to high-spatial-resolution imaging techniques such as fMRI. The spatial resolution of EEG is determined by the number of electrodes. The spatial precision of EEG is fairly low but can be improved by spatial filters such as the surface Laplacian or adaptive source-space-imaging techniques. The spatial accuracy of EEG is low. Activity recorded from one electrode does not reflect only activity from neurons directly below that electrode, but rather, from a complex mixture of activities from many brain regions close to and distant from that electrode.
Lastly, the signals captured by the EEG reflect meso- and macroscopic scales, but not microscopic scales which involve individual neurons or columns of neurons.
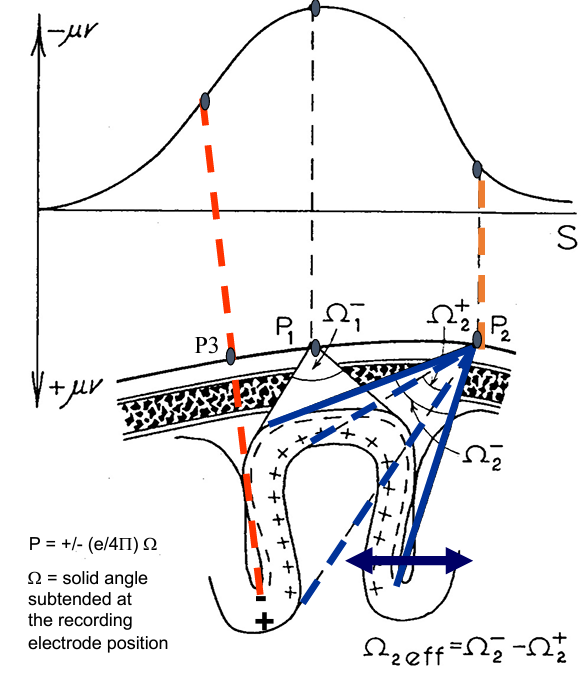
Figure 89. Orientation of the signal influences the amplitude captured in the EEG. Negative values are the result of the electromagnetic field imposed by the dipole in which there is electronegativity closer to the electrode (fEPSPs).
Comments
06/07/2024 - 100 years of EEG!
A single minicolumn or even a single macrocolumn (containing about
As a general "rule of head," about
The tissue label "synchronously active" in this context is based on cortical recordings with macroscopic electrodes and must be viewed mainly as a qualitative description. In the case of dipole layers in fissures and sulci, tissue areas larger than
As such diffusion physics is still restrained on the amount of cortical activation in order to produce measurable electrical activity in the range of
EEG signal magnitude determinants:
- Neuron geometry
- Synaptic Distribution
- Source Depth
As such, EEG may originate with a mixture of network and non-network activity.
Clean EEG
Clean EEG should be stationary (On preprocessing EEG data). However, its ambiguity makes it an unpopular concept to assess whether the data is clean.
Cost
EEG setups can cost as much as fMRI or EMG ones (around 150,000$) (cohenAnalyzingNeuralTime2014).
References
- nunezElectricFieldsBrain2006
- Lex Fridman Podcast - 438 – Elon Musk Neuralink and the Future of Humanity
Links
Notes
list from [[]] and !outgoing([[]]) and (#baby or #child or #adult or #topic or #domain)
sort file.name asc
Articles
list from [[]] and !outgoing([[]]) and #article
sort file.name asc
Others
list from [[]] and !outgoing([[]]) and !(#baby or #child or #adult or #topic or #domain or #article)
sort file.name asc